

An e-reader friendly version can be downloaded here
In 2017, Pakistan imported toilet paper worth US$111 million. But, with a current account deficit exceeding US$20B, Pakistan’s import cart is heaving with a lot more than just tissue rolls.
From raw material to final products, from the USA to Indonesia, Pakistan imports a whole host of goods from a wide range of countries (Figure 1). While imports of raw material such as oil, chemicals and rubber (Figure 2), have risen significantly since the economic liberalization of the 1990s, so have imports of intermediate and final goods, such as machines and cars.
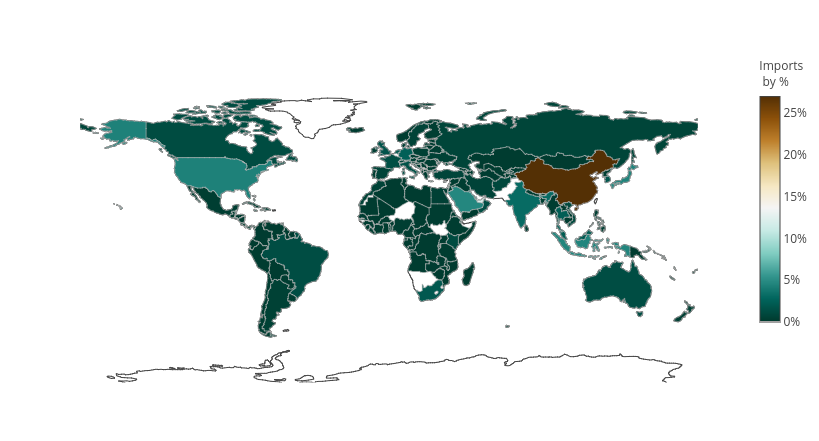
Figure 1. Pakistan’s import partners, by percentage of total imports. In 2017, Pakistan’s total import bill was $55.6B. China was the largest source of imported goods followed by the UAE, Saudi Arabia, Indonesia, and Japan.
In this context, Pakistan’s exchange rate policy has not been conducive to growth. Successive exchange rate devaluations, particularly since the mid-2000s, have increased the cost of imports and debt servicing with relatively little impact on exports, in effect delivering little other than extreme inflationary pressure on the domestic economy and exponential growth in the current account deficit.
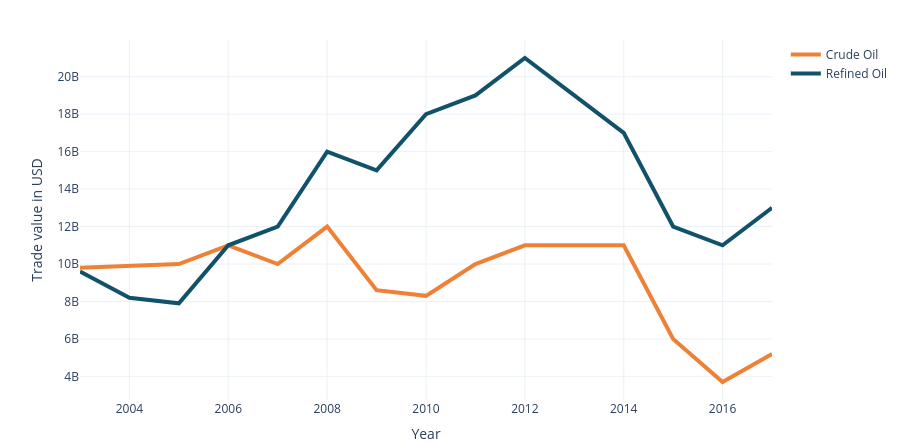
Figure 2. A major component of the country import basket is oil. Since 2006, Pakistan has imported more refined than crude oil. A massive uptick in the last decade has placed substantive pressure on the balance of payments.
Unsurprisingly, every time the rupee loses value against the dollar, two opposing schools of thought clash. Advocates of a market-determined exchange rate argue that a systematically overvalued rupee favors imports at the expense of exports and domestic industry. Managed rate supporters argue that an overvalued rupee is vital given that the domestic economy depends on imports of petroleum products, sophisticated machinery, and other intermediate goods; therefore, higher import costs will flow through to the end-user leading to inflation and a slowing economy.
What then is the rationale for using the exchange rate as a tool of economic policy? As is the case with most questions in economics, the answer is somewhere in the middle. To understand the impact of exchange rate policy on Pakistan’s economy, it would be useful to explore Pakistan’s import basket.
China: Pakistan’s industrial backbone
China accounted for 27% of Pakistan’s imports in 2017 (UN Comtrade, 2017), (Simoes, 2011) providing critical industrial items such as broadcasting equipment, semiconductors, electric transformers, pumps, cranes and turbines worth approximately US$6.5B in nominal terms (Figure 3). This is a field in which Pakistan lacks significant comparative advantage, and as these items are critical to the country’s infrastructure and therefore, growth, this machinery must be imported. Giving the users of these capital goods some relief with an imports-driven exchange rate policy is therefore normatively appealing.
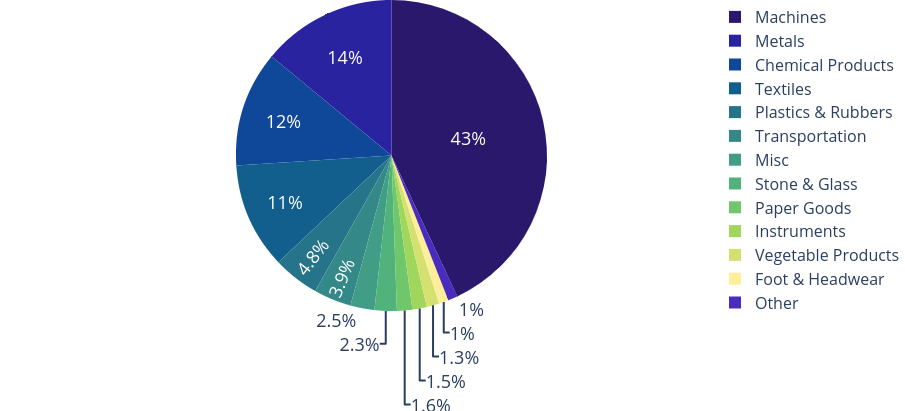
Figure 3. Break down of Pakistan’s imports from China in 2017, by sector.
The Chinese basket also contains metal products like iron and steel, copper, and aluminum including US$464M worth of flat-rolled steel in 2017 alone (Hasnain, 2018). While Pakistan Steel Mills, (PSM), a potential industrial powerhouse, had until recently, been left to devolve into an unmitigated disaster, there are larger macro-economic challenges at play behind Pakistan’s enormous metal imports bill than just the mismanagement of PSM. These include, inter alia, a highly fragmented playing field which precludes savings from economies of scale, obsolete technology, high energy costs, low quality products and finally, low import duties all of which contribute to boosting imports of cheaper and better quality steel. A quick glance at the agricultural industry, (which accounts for a third of Pakistan’s exports), reveals a similarly complex situation. Crucial chemical inputs for farming including nitrogen and sulfate compounds as well as acids are imported, as are expensive final products such as fertilizers (US$425M) and pesticides (US$73M). Again, a low exchange rate reduces some costs of production; unfortunately, it also strangles domestic production at the low end of the supply chain and makes Pakistan’s exports uncompetitive at the higher end.
UAE and Saudi Arabia: Oiling the Cogs
Pakistan’s next two biggest import partners after China, are UAE and Saudi Arabia accounting for 12% and 4.5% of imports respectively. The bulk of imports from these two countries are petroleum products that Pakistan has to, axiomatically, import (Figure 4 and Figure 5). The primary consumers are the transportation and power industries. However, it is clear that these resources are not being used optimally. The power generation industry suffers from under investment and gross inefficiencies ranging from poor infrastructure and insufficient supply of natural gas to power theft and distortionary subsidies all of which lead to sub-optimal allocation of a scarce resource.
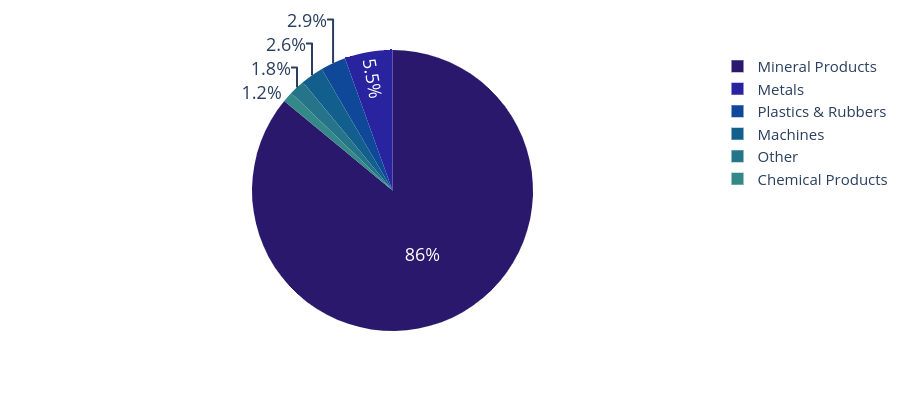 Figure 4. Breakdown of Pakistan’s imports from the UAE in 2017, by sector. Mineral products include crude oil and refined oil.
Petroleum consumption by the transportation industry is increasing exponentially, yet a coherent urban transportation policy is woefully lacking (Business Recorder, 2017). Metro train projects in Peshawar and Lahore have seen multiple delays while no stakeholder is willing to take ownership of the project in Karachi. More broadly, the rapid increase in urban sprawl and constraints on vertical development are not only fueling demand for petrol but also causing irreversible environmental damage (Haque, 2017). Thus, both urban transportation and urban development are in need of urgent attention from policymakers.
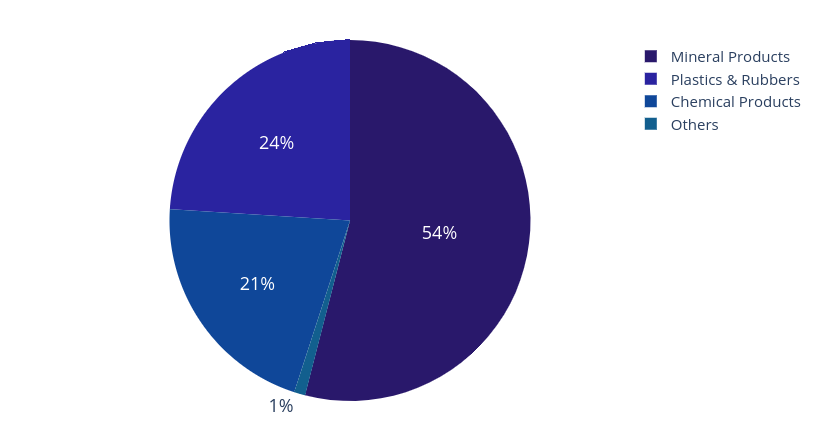
Figure 5.Break down of Pakistan’s imports from Saudi Arabia in 2017, by sector. Mineral Products includes crude and refined oil.
Japan: Keeping Pakistan Moving
As mentioned above, the demand for fuel is partly driven by the transportation industry, in turn underpinned by a growing demand for, mainly imported, cars. Thus, in 2017, Japan accounted for 4.3% or US$2.4B of Pakistan’s imports (Figure 6), 51% of which related to the transportation industry. Cars accounted for US$665M; trucks, tractors and buses made up US$318M, while vehicle spare parts worth US$100M rounded off the rest. Such numbers beg the question: has the state policy of incentivizing the automotive sector worked?
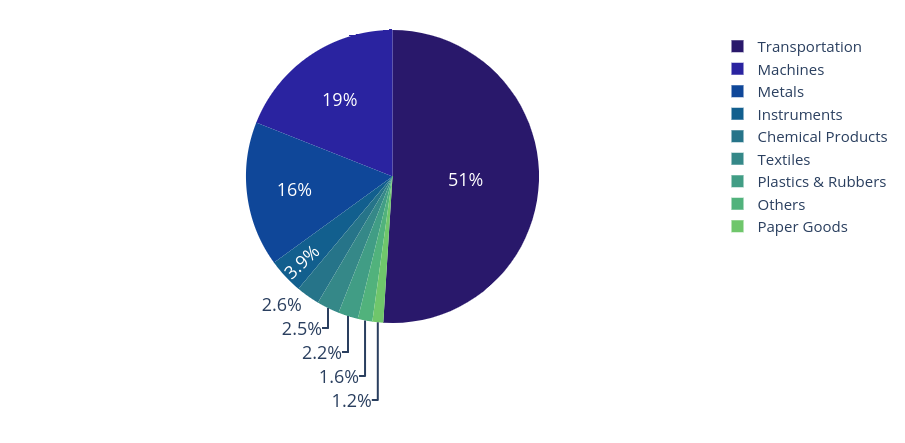
Figure 6. Break down of Pakistan’s imports from Japan in 2017, by sector. Transportation includes cars, trucks, vans, etc.
Certainly, the promised technological transfer has not materialized. Domestic production is concentrated at the low-end Japanese cars; lack of local research and development (R&D) and innovation has meant there have been little or no technological or design advances upon these models over the last few decades. (Qayyum, 2019); nor is there any evidence of spillover across sectors (Moretti, Steinwender, & Van Reenan, 2014). While the defense sector has invested heavily in R&D — the JF-17 Thunder is the jewel in the crown — technological spillovers further down the supply chain into the automotive or management and repair industries have not occurred.
For comparative purposes, consider Bell Labs. During its heydays, it was a hub for American defense R&D, but spillovers meant it was the mecca of scientific advancement for decades (Gertner, 2012). Researchers associated with the lab helped develop the transistor, the laser, photovoltaic cells, the Unix operating system, C, and C++. Last, but certainly not the least, the lab was home to the father of the information age, Claude Shannon (Soni & Goodman, 2017).
Returning to domestic production capacity downstream of the supply chain, a quick glance at the remainder of Japanese imports reveals that this too is dominated by imports: machines and metals accounted for 19% and 16% of total imports from Japan in 2017. The laundry list of vital parts and equipment includes engine parts, looms, centrifuges, textile fiber machinery, gaskets, and transmissions. A birds eye view of Pakistan’s industrial landscape – dotted with textile and grain mills; steel and cement plants; oil refineries and power plants – reveals that the demand for Japanese machinery and equipment encompasses all sectors as in the current technological environment, Pakistan does not have the domestic capacity or capability to meet this demand.
All of Pakistan’s major industries are therefore vulnerable to the vagaries of the exchange rate and at one point in the supply chain or another, stand to benefit from an overvalued rupee.
However, a systematically overvalued rupee means it is easier for other goods to get through too.
Indonesia: Down the greasy pole
Pakistan’s imports from Indonesia accounted for 4.4% of its import bill with palm oil accounting for almost two-thirds of this (Figure 7). Palm oil, used primarily in food processing, is not an intermediate good for a high value-added, export-oriented product. Instead, it is part of the local consumption bundle and hence not as economically productive as importing looms and centrifuges. Alarmingly, Pakistan’s annual palm oil imports from Indonesia, have reached US$1.5B. Could the underlying cause be an overvalued rupee that has made ready-to-use imported palm oil so cheap that importing oil seeds and producing palm oil in Pakistan or investing in local refining is more expensive than importing it from Indonesia or Malaysia (Business Recorder, 2017)?

Figure 7. Break down of Pakistan’s imports from Indonesia in 2017, by sector. Animal and vegetable bi-product category mostly consists of palm oil.
USA: Nuts and Bolts
Pakistan’s imports from the US perfectly embody its exchange rate catch 22, (Figure 8). US goods account for 4.2% or US$2.3B worth of Pakistan’s annual imports. Of those, almost 20% are vegetable products and 20% are machines. The former include soybeans, chickpeas, corn, other dried legumes as well as almonds and walnuts. The latter consists of hi-tech equipment such as computer data storage units, CPUs and crucial machinery such as air and gas compressors, gas turbine engines and parts for boring machines all of which are essential building blocks for economic growth. How does the policymaker choose which ones to favour?
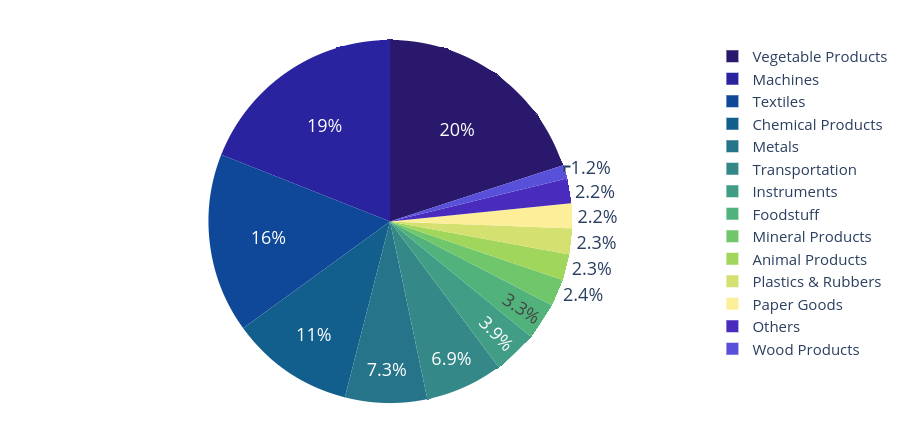
Figure 8. Break down of Pakistan’s imports from the US in 2017, by sector. The wide array of goods Pakistan imports from the US embodies the policymakers’ exchange rate dilemma.
Pakistan’s imports as drivers of growth
A quick analysis of Pakistan’s imports by industrial sector reveals critical drivers of economic growth account for a significant proportion of these. Mineral products (including crude and refined oil, coal, gas) and machinery make up 43% of the basket; 23% and 20% respectively (Figure 9); followed by chemical products (including fertilizers, pesticides, and antibiotics) at 11% and metals at 9%. Textiles, vegetable products, and transportation goods contribute a total of almost 20%. It is painfully clear that Pakistan’s domestic economy is cripplingly dependent on raw material imports.
Given the extent of heterogeneity in Pakistan’s imports it is also apparent that any import-export policy has to be finely balanced to manage the conflicting demands of import dependent, value-added industries and domestic or export-driven manufacturing and agricultural industries. In such a complex environment, an exchange rate policy with a single focus is arguably not optimal.
The way forward
It is noteworthy that Pakistan’s top five trading partners by imports are in Asia: China (27%), UAE (12%), Saudi Arabia (4.5%), Indonesia (4.4%), and Japan (4.3%). While the UAE and Saudi Arabia make the list because of their natural endowment of oil, Pakistan ought to view China, Japan, and Indonesia as role models for economic development. The Nobel-winning development economist Simon Kuznets famously said that there are four types of countries in the world: developed, developing, Japan, and Argentina (The Economist, 2019). Argentina, despite a wealth of natural resources like agricultural land, minerals, forests, and its early advantage in economic development, has descended into chaos over the past few decades (Encyclopedia Britannica). A frequent IMF client, Argentina has been the subject of 22 bailout programs and memorably defaulted one during 2001 (Smith & Mander, 2019).
At the other end of the spectrum, sits Japan. Although not remarkably rich in natural resources, the country has risen from the ashes of World War II, leveraging hi-end technology transfers, investments in education, R&D, innovation, and a work ethic paralleling none to build an economy rivaling the world’s largest global economies and is home to some of the world’s most successful firms.
Pakistan is on its 13th IMF bailout. It needs to act fast to keep the yawning gap between imports and exports from widening further still, (Figure 10). The diverse nature of Pakistan’s imports means that both policymaking and public discourse must be broad-based and strategic rather than narrow and tactical. Prudent exchange rate management to curb excessive volatility and moderate pass-through must be situated within a comprehensive, long-term economic development policy. A rigid policy of pegging the exchange rate and not updating it for extended periods despite feedback from the markets can have detrimental consequences for the economic health of the country. An inflexible peg that has failed to rectify the trade imbalance will inevitably run into the problem of limited foreign exchange reserves. Once the peg becomes inflexible, investor confidence — ever so fickle —erodes rapidly creating conditions ripe for a Minsky moment.
This brief but ultimately revealing examination of Pakistan’s import cart points to a lack of strategic vision for Pakistan’s long-term economic development policy. This will have to be the subject of a separate policy paper; in the context of this paper’s focus on exchange rate policy and impact on imports, however, it is pertinent to ask the following questions:
- What are the barriers to entry in Pakistan’s manufacturing industry?
- To what extent is an over-valued rupee a barrier – are cheaper imports crowding out domestic production?
- Are increasing imports merely reflecting a demand-supply imbalance where Pakistan lacks the infrastructural capacity to meet domestic demand?
- Or are they a symptom of a deeper malaise such as substandard products, lack of technical skills, investment in R&D and quality control?
Pakistan’s policymakers ought to consider the barriers to local production for each of the items in Pakistan’s import cart. Some will undoubtedly benefit from a policy focused on boosting domestic production and in the long-term no longer appear in the import basket. Others, such as oil, will, of necessity, remain. Developing comparative advantage is undoubtedly a long-term policy issue, but Pakistan’s current policies seem to suggest it is in danger of using exchange-rate policy as a development tool instead.
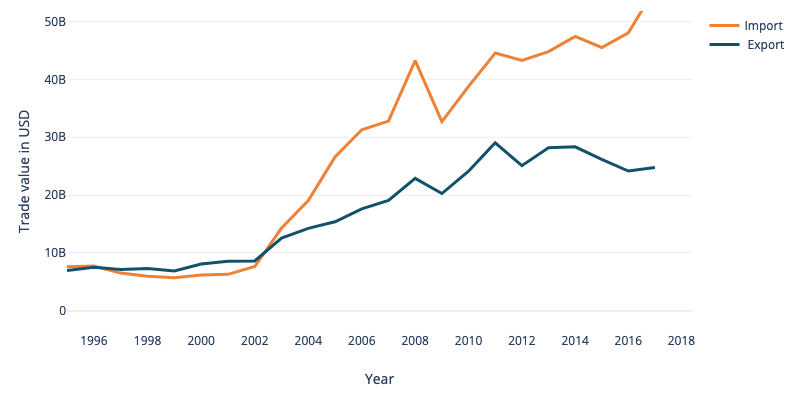 Figure 9 A yawning gap: since the early 2000s, Pakistan’s imports and exports have diverged, possibly due to the liberalization policies of 1990s and 2000s. However, since 2010, exports have stagnated while imports have grown unabated. In recent years, the gap between the two has become wider than a sportsperson’s yawn.
Policymakers need a paradigmatic shift away from short-term, tactical solutions such as exchange-rate manipulation, subsidies and taxation structures that inhibit growth and create barriers to entry. A holistic approach to economic development – built on sound monetary and fiscal policy, developing infrastructure and investing in education and R&D to realize the potential of one of its greatest assets: its people – is a critical and immediate need.
End Notes
- Business Recorder. (2017). Palm Oil Import Substitution. Retrieved from Business Recorder: https://www.brecorder.com/2017/09/25/371248/palm-oil-import-substitution/
- Business Recorder. (2017). Petroleum Consumption Unabated. Retrieved from Business Recorder: https://www.brecorder.com/2017/10/06/373412/petroleum-consumption-unabated/
- Encyclopedia Britannica. (n.d.). Argentina. Retrieved from Encyclopedia Britannica: https://www.britannica.com/place/Argentina/Resources-and-power
- Gertner, J. (2012). The Idea Factory: Bell Labs and the Great Age of American Innovation. Penguin.
- Haque, N. (2017). Looking Back: How Pakistan became an Asian Tiger in 2050.
- Hasnain, S. (2018). The Demise of Pakistan Steel Mills. Retrieved from Herald (Dawn): https://herald.dawn.com/news/1153574
- Moretti, E., Steinwender, C., & Van Reenan, J. (2014). The Intellectual Spoils of War? Defense R&D, Productivity, and Spillovers. American Economic Association Annual Meeting. San Francisco, CA.
- Qayyum, F. (2019). What is Pakistan’s Car Industry Good For? Retrieved from Prism (Dawn): https://www.dawn.com/news/1462593
- Simoes, A. J. (2011). The Economic Complexity Observatory: An Analytical Tool for Understanding the Dynamics of Economic Development. Workshops at the twenty-fifth AAAI Conference on Artificial Intelligence.
- Smith, C., & Mander, B. (2019). IMF’s Reputation on the Line in Argentina. Retrieved from Financial Times: https://www.ft.com/content/b3d9c544-74b3-11e9-be7d-6d846537acab
- Soni, J., & Goodman, R. (2017). A Mind At Play: How Claude Shannon Invented the Information Age. Simon and Schuster.
- The Economist. (2019). How Argentina and Japan Continue to Confound Macroeconomist. Retrieved from The Economist: https://www.economist.com/finance-and-economics/2019/03/28/how-argentina-and-japan-continue-to-confound-macroeconomists
- UN Comtrade. (2017). United Nations Commodity Trade Statistics. Retrieved from http://comtrade. un. org
Currently a doctoral student of Macroeconomics and Finance at Yale University. He holds a Masters degree in Economics. He analyses distressed asset markets using networks and deep learning.